

The Event Is Up 18% — Or Is It? Reading Trajectory Honestly
Every event prospectus contains a growth figure. Attendance up eighteen percent. Exhibitors up a quarter. Record-breaking edition. The number is almost always technically true and almost never sufficient, because growth in what, measured how, against which year, are all decisions the person selling you space got to make.
Here is how to read an event's direction properly, and why a single percentage should never satisfy you.
Growth of what?
"Up eighteen percent" can mean total registrations, walk-in footfall, unique visitors, exhibitor count, floor space sold, or badge scans. These move independently. An event can grow its registrations while losing exhibitors — usually by discounting attendance to fill the hall for the people paying for booths. That is not health. It is the specific shape of decline.
The signal that resists this is exhibitor retention between editions: of the companies that exhibited last time, how many came back. It is hard to dress up, because it is a decision made by people who paid to be there and then decided whether to pay again.
Against which year?
Comparisons to 2020 or 2021 are meaningless and still appear in prospectuses. So do comparisons to a deliberately chosen weak year. A trajectory needs a series, not a pair — three or four editions minimum before direction means anything.
Measured by whom?
Almost always the organiser, using a method they are not obliged to publish. Not fraud; just the ordinary asymmetry of any market where the seller supplies the measurement.
What an honest trajectory looks like
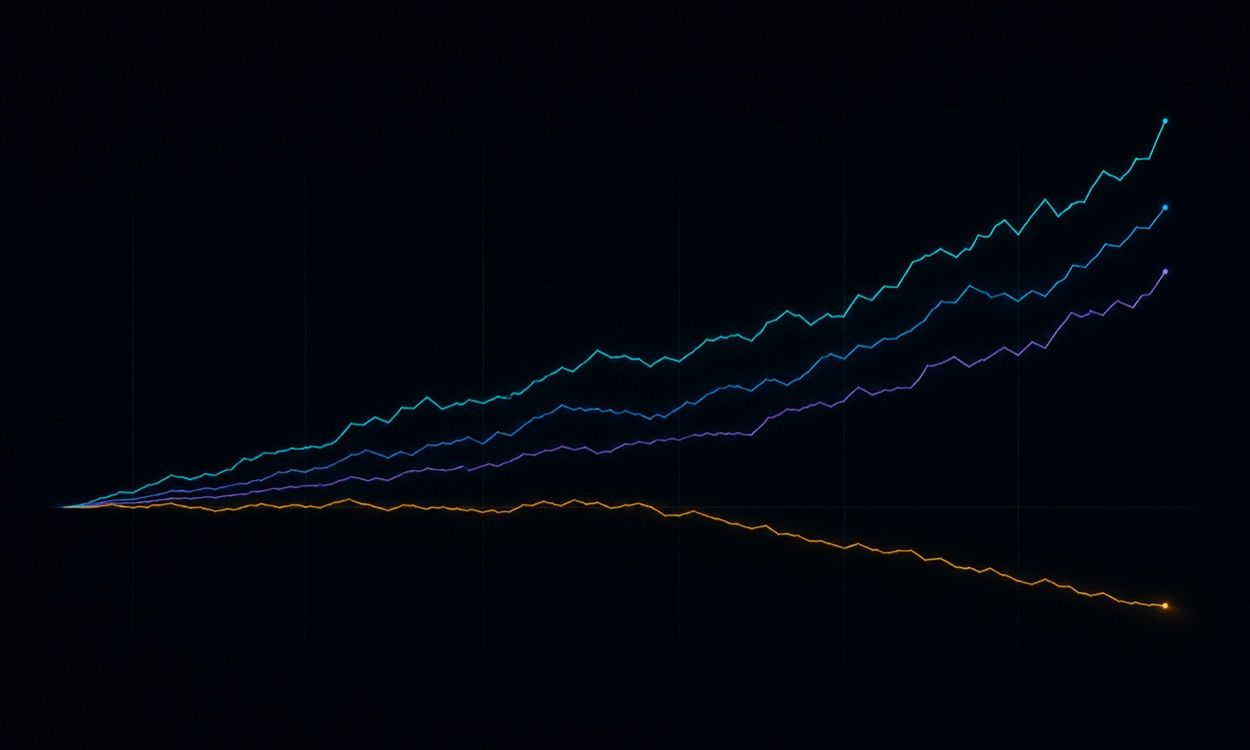
We publish trajectory as a label with its components visible, not a single blended number — Growing, Steady, Fading, or Watch. The reason for the label rather than a score is that blending different kinds of evidence into one figure hides exactly the disagreements you most need to see.
Underneath sit the parts:
Demand trend — whether interest in the event is rising or falling, from search and platform signals rather than from the organiser.
Exhibitor continuity — the overlap between consecutive editions' exhibitor lists. Expressed as a percentage of overlap, never as an absolute count, because our record of any single edition is partial and a count would imply a completeness we do not have.
Return intent — what attendees said about coming back, from post-event sentiment.
Each carries its own confidence. And when they disagree — demand rising while exhibitors quietly leave — the label reads Watch, and shows you the disagreement rather than averaging it into a comfortable middle.
Why "Watch" is the most useful state
An event where demand and retention point in opposite directions is the most interesting event on your calendar, and the one a single growth percentage will always describe wrongly. Usually it means the audience is still coming but the commercial side has stopped believing — the phase before a decline becomes obvious to everyone.
Catching that a year early is worth more than any of the other states. It is also precisely what gets averaged away the moment you compress everything into one number.
What we won't do
We won't tell you an event is growing when our record of it is too thin to say. Below a confidence threshold the trajectory renders as a dash with the reason attached, not as a guess. An estimate presented as a finding is worse than an admitted gap, because you cannot audit a number that looks confident.
And we won't tell you an event is bad. Fading is not a verdict — a shrinking show can still be exactly the right room for your category. Trajectory tells you which way it is moving so you can decide what that is worth. That is a different thing from being told what to do, and it is the only version of this that is honest.
Calculate your Share of Presence at whr.ai.